Showing posts with label Poor Partial Equilibrium Analysis. Show all posts

Saturday, November 27, 2010

A Woman. A Prostitute. A Slave.

New York Times article "A Woman. A Prostitute. A Slave." (November 27th, 2010)states that, when it comes to ending forced prostitution "There are no silver bullets, but the critical step is for the police and prosecutors to focus more on customers (to reduce demand) and, above all, on pimps."Corrections has a silver bullet: legalize prostitution. Essentially reiterating an earlier point ("Enabling prostitution" from September 3rd, 2010), it seems rather obvious that forced prostitution is an inferior input into prostitution services. Presumably, upon the legalization of prostitution, willing prostitute supply will shift out dramatically more than forced prostitutes.  This will cause forced prostitute quantity to shift down. We depict the silver bullet to severely decrease forced prostitution in the United States graphically below (click to enlarge).
The responsibility for the larger amount of unwilling prostitutes is on those that oppose legalized prostitution.

Wednesday, November 17, 2010

No, They're Not a 'Hitler' or a 'Stalin'

New York Times article "No, They're Not a 'Hitler' or a Stalin'" (November 16th, 2010) offers a complete misreading of Russian history leading up to the Second Congress of Soviets following the October Revolution of 1917.
Communism has never once arisen — not in the U.S.S.R., not in China, not in Cambodia, not in Cuba, not in Vietnam, not in North Korea — as the cumulative result of social reforms. It was always brought by violent revolution carried out by a fanatical minority, usually during or right after war. Once in power, committed revolutionaries sought to transform agrarian countries such as Russia or China into modern industrial states by oppressing peasants and applying political terror.
This is not true. The lead-up to the Russian Revolution was 56 years in the making, seeing a series of social reforms brought on by both violent extremists and political reforms. In the period between the Peasant Reform of 1861 and the October Revolution, Russia saw the freeing of the serfs, an overhaul of the penal code and judicial system, the creation of the Duma, the legalization of trade unions, organization of political parties, and the creation of local elective bodies with their own taxation rights. To be sure, Russia also saw anti-liberal reforms, but this strengthens the point that this period of great social reform lead directly to the Revolution of 1905, which in turn found its new steady state after the February and October Revolutions of 1917.

The claim that Communism did not result from "cumulative reforms" is a fallacy. Cumulative reforms certainly co-moved with increasing instability in Russia over the course of a half century, leading to the first Communist government, enabling it to kill tens of millions of people until its fall in 1991.

Saturday, October 30, 2010

Don't judge the jobless

USA Today article "Don't judge the jobless" (October 27th, 2010) discusses "99ers", individuals who have collected extended unemployment insurance for 99 weeks and are about to run out. The author, while attacking Robert Barro who "doesn't know what it's like to be unemployed for this long," claims:
My story isn't unusual for young professionals.
It actually appears to be quite unusual. In order to see why, we can take general U.S. statistics as a first pass. Two questions are important to finding out if someone will be a "99er." The most important is "what are the chances an individual finds a job in a given month?" (Alternatively, "how long does it take to find a job?") We can examine the job finding rate per month as approximately equal to the number of unemployed re-entering the workforce. This isn't an exact statistic, as individuals may move from job to job, but it will be rather close. The number of jobs found in a given month over the number of unemployed for that month is displayed graphically below, and is known as the "job finding rate" (click to enlarge).


How might we interpret the above graph? As of August 2010, the number of hirings/unemployed was 0.32. That is, 1/3 as many people were hired as were unemployed. Extending this logic and making a few assumptions (homogeneity, only the unemployed are hired, both assumptions we shall defend as simplifying, but not result-altering later) that only the unemployed are hired, then the average individual should spend 3 months unemployed, or 13 weeks unemployed. 33% will spend one month, 22% will spend 2 months, 15% will spend 3 months, 9% will spend 4 months, and so on. To spend 22.77 months unemployed (99 weeks) comes with a very small probability-- 0.02%. Two hundreths of one percent is rather uncommon indeed. But this is slightly wrong for a number of reasons, though it is relatively accurate as a first pass. Say 30% of those new hires come from people moving jobs. We still have the probability 0.4%, or about half a percent.

First, the author notes that they were re-hired for a four-month stint before becoming unemployed again. We can ask a similar question: "What are the chances (making similar assumptions) that someone who was hired will last for four months?" We can find this from the "job loss rate", calculated as the number of fires, or separations (depending on your preference) displayed graphically below (click to enlarge).

In any given month, about 1.75% of currently-working Americans are fired, and about 3% separate from their job (for the interested, this gives about a 33-month average for a given job, reasonable when teenagers and young adults are added to the picture). In Correction's recollection, adults spend something approximating double that on a given job. What are the chances the author will be fired within four months of finding a job? Making similar assumptions, there's a 93.2% chance that an individual will not be fired before four months. That is, the chance the author would be fired within four months (or less) was 6.8%. While not as small a probability as a hundredth of a percent, this still puts her in a very small minority.

Corrections recognizes that these calculations assume a homogeneity that is not present. However, in the author's case, we actually think these assumptions have helped her. The inability to find jobs has fallen primarily on men, the uneducated, and construction workers. The author, formerly in the information industry, a woman with a college degree, will be less, not more common. Rather than attacking Robert Barro, who "doesn't know what it's like to be unemployed for this long" for a reason, and who wrote the (text)book(s) [1] [2] [3] on modern macroeconomics, the author would be better served by spending time looking for work. Her plight does not seem as common as suggested, and it appears rather difficult to rack up 99 weeks of unemployment, especially if one is college-educated and not in construction.

There is further data about unemployment insurance that Corrections has mentioned before ("Loss of Jobless Benefits Could Lower Unemployment Rate" July 6th, 2010). Even in the depths of Pittsburgh's recession in the early 80's, where local unemployment was higher than it is now nationally, individuals suddenly found jobs when their unemployment insurance ran out (click to enlarge):

Sunday, October 3, 2010

On the Pulpit, Rabbis Earn More Than Christian Clergy

Normally, Corrections avoids old articles.  However, Jewish Daily Forward article "On the Pulpit, Rabbis Earn More Than Christian Clergy" (September 15th, 2010) wonders aloud why rabbis are paid, on average, more than christian clergy. It comes to no firm conclusions. Indeed, Corrections spent some time thinking on the curious problem: Catholics and Protestants appear to be paid between $25,000 and $40,000, while Reform and Conservative Rabbis appear to be paid between $137,000 and $147,000. A rather large gap.

Corrections came to the weak conclusion that the story was about opportunity cost and relative wealth status. However, the same publication came out, two weeks later, with the article "Rabbi Searches Are Tough, but Are They Illegal?" (September 29th, 2010). This article mentions nothing about pay, and merely describes the theological implications of a cartel of Rabbis:
The RA requires synagogues to enroll exclusively in its search process, filters the selection of candidates the congregations may interview, and prohibits candidates and congregations from finding each other directly. Any Conservative rabbi who seeks a pulpit outside the RA’s centralized process, and any congregation that interviews candidates from other movements, will be penalized.
It bespeaks either a deep ignorance of economics or a willing deception of their readers that the Forward did not connect the two. To note that Rabbis have a firm cartel with punitive powers on the one hand, then wonder why Rabbis are paid so much on the other is ludicrous.

Cartels artificially limit supply to raise prices. It utterly clear to Corrections that the Rabbinical Assembly is a cartel of Rabbis that artificially constricts supply and raises wages. The Rabbinical Assembly's cartel also possibly increases quality above what the market would demand to further drive up price, though there is no evidence for this either way (merely a likely possibility). A depiction of what the Rabbinical Assembly is practicing may be found graphically below (click to enlarge).

Saturday, October 2, 2010

The New American Normal

New York Times article "The New American Normal" (September 27th, 2010) states that there may be heterogeneity in the ability of traders to make money during various market conditions. Corrections doesn't see this as being the case. We expect that a trader has an equal opportunity to have a positive expected value on a trade whether the market is highly volatile or not.
Fragmentation holds sway. The stock market used to be a fair proxy for the state of the economy. Now it’s a market of traders, not investors. They want to know what the spread is today and tomorrow; they can make money on the way up or down; they care far less about U.S.A. Inc.

So the market goes where it goes — up of late but largely directionless (which makes it harder on those up-or-down traders) — while out on Main Street the struggle to make family payroll continues. People work longer hours, they juggle how to cover their kids’ needs, how to de-leverage just a little — and they’re still meant to “consume” for the economy’s sake.

First, for the ill-defined class of "up and down traders", we might consider they do better when the market is highly variable. However, a quick view of the 30-day average S&P 500 price variance dispels this notion rather quickly (click to enlarge). If anything, Corrections expects that the average trader did better in the low volatility areas than the high (NBER recession dates are colored in grey).

Either way, it's ludicrous to claim that traders like one market environment over another, unconditional on their current assets. Unconditional on current assets, a trader who believes the market will be constant will be able to make money off selling a put below the current price (believing a stock won't go below the sum of strike price and premium) and selling a call above the current price (believing a stock won't go above the sum of the strike price and premium). A trader can flip sides on the trade if he thinks volatility will be high. If the market is undergoing a constant increase, then demeaning by the expected trend yields the same trading strategy. Whatever the market conditions, it's rather simple to construct trading strategies that require simple adjustments. The level, rate of change, and volatility won't matter.

The only manner in which changing market conditions may matter to a trader is an increase in the cost of capital (for deals requiring leverage) a decrease in their ability to utilize specific knowledge or expertise (analysis of mergers and acquisitions may presumably require expertise and contain a cyclical trend), or if the trader already owns positions in the market and does not want those to decline--distinctly separate (though difficult to distinguish without data on specific trends) from their ability to make money off present market conditions.

Friday, September 24, 2010

Our view on consumer protection: When cable guys don't show, give customers some dough

USA. Today article "Our view on consumer protection: When cable guys don't show, give customers some dough" (September 22nd, 2010) is ill conceived. USA Today's editorial advocates a New York City bill to penalize cable companies when repairmen don't show.
In response to complaints about bad repair service, the city has drafted a contract with its major cable TV providers, Time Warner and Cablevision, with this provision: If a technician fails to show up inside the promised service "window," the company has to give the customer a month's service for free.
The only good news is that this gives phenomenal evidence that the government is unable to craft an effective law. It is hardly worth noting what is wrong with this sort of regulation, save to note that if this were effective, why not make cable companies pay $1,000,000 for each late repairman? One thing an economist and the government could agree on: there would be no late repairmen ever again.

Friday, September 17, 2010

Recession Raises Poverty Rate to a 15-Year High

New York Times article "Recession Raises Poverty Rate to a 15-Year High" (September 16th, 2010) fails to acknowledge the poverty rate's intertemporally unstable nature. It compares poverty rates over time, an improper comparison due to the way poverty rates are calculated.

The share of residents in poverty climbed to 14.3 percent in 2009, the highest level recorded since 1994. The rise was steepest for children, with one in five affected, the bureau said.

One might think that individuals in the U.S. were only as well off as they were in 2004, when chained GDP/capita was approximately the same as it is this quarter. However, Corrections contends that we are actually even better than this. Below, find graphically depicted U.S. GDP over time in chained 2005 dollars (click to enlarge), and U.S. GDP per capita over time in chained 2005 dollars (click to enlarge). Note that chaining dollars is an attempt to introduce new products for comparison (otherwise, comparing cell phone prices from 1960 and today would not be well-defined).


The poverty rate from 1994 is measuring something completely different from the poverty rate in 2009. Poverty thresholds have changed multiple times, under a "sliding scale" approach. For example, in 1964, ~2.6% of U.S. households owned a color television. Circa 1994, 97% of U.S. households owned a color television. Beyond this, these televisions were not only cheaper, but were of better quality, programming, and durability.

Why is this relevant? Because increasing product quality is not properly measured, even with chained GDP. Below, we take minivans as an example.

In 2003, using Barry, Levinson and Pakes's instrumental method for demand estimation (also discussed in a previous post), Amil Petrin, in his phenomenal paper, "Quantifying the Benefits of New Products: The Case of the Minivan" (JPE 2002) estimates the value in dollars to consumers from the advent of the minivan by Chrysler in its first five years (1984-1988) as $2.8 billion in consumer surplus, and $2.9 billion in total surplus.

This surplus comes solely from an improvement in product quality that is largely unreflected in price due to monopolistic competition by competitors (GM and Ford introduced their own minivans in 1985). This sort of change will not be reflected by even chained GDP numbers. Because of increasing product differentiation (Petrin's "new goods" problem) and monopolistic competition (or competition), life is getting better than we're measuring with our best measures of product-chained GDP. Quality of life is higher.


Poverty indicators are not appropriate for "long" time spans because of innovation. Locally, we might think 2008 and 2009 are comparable. But in 1994, the internet had yet to be invented. Since then, as Austan Goolsbee and Peter Klenow estimate in "Valuing Consumer Products by the Time Spent Using Them: An Application to the Internet" (AER 2006) (gated) (ungated), the median individual gained $3000/year because of the advent (and widespread use) of the internet. The reason for this large gain is largely due to increased price competition and increased value of time. Since 1994, almost everyone in the United States is vastly better off than they were. (Another example might be how much individuals would have paid for a smart phone in 1994, given the millions that have them now and how "little" they paid for them relative for 1994 willingness-to-pay). This massive increase in consumer surplus generated from an increased value of time is unmeasured by GDP (underestimated) and poverty measures (overestimated). Use of these to compare long-run trends is ill-advised, especially when one has an ideological/Malthusian axe to grind.


Unfortunately, the notion that GDP growth generally underestimates utility gains is almost universally ignored in long-run intertemporal comparisons of utility.

Thursday, September 16, 2010

F.D.A. Panel Urges Denial of Diet Drug

New York Times article "F.D.A. Panel Urges Denial of Diet Drug" (September 16th, 2010) discusses the FDA's rejection of a new diet pill and their standards without addressing the improper incentives that lead the FDA to cause the excess deaths of thousands of people a year, and cause excess pain to hundreds of thousands.
The advisers to the Food and Drug Administration voted 9 to 5 that the potential benefits of the drug, called lorcaserin and developed by Arena Pharmaceuticals, did not outweigh the risks.
Let's imagine, for simplicity, that there are two kinds of medical drugs. Drugs that save lives, and drugs that kill people.  When pharmaceutical companies test drugs, they gain a signal with error about whether or not that drug is a good drug or a bad drug. The U.S. Food and Drug Administration will then choose the cutoff. If we assume that error to be normally distributed (this is an innocuous assumption: the difference between the sample average and the true signal converges to a normal distribution by Lindeberg-Levy Central Limit Theorem).

The FDA must choose some threshold for a signal, below which they reject all drugs, and above which they accept.  They save lives by rejecting bad drugs and accepting good ones.  The FDA kills by rejecting good drugs or accepting bad bad drugs.    (Corrections is willing to discuss our precise "moral" phrasing, which we posit as accurate).

The FDA can't tell the difference between good drugs and bad drugs beyond the signal they receive. The point, therefore, is what the proper cutoff should be. Whether or not the FDA should be "very cautious" and kill by denial of more good drugs than prevention of bad, or "loose" and kill by allowing more bad drugs than good drugs. The optimal "life saving" diagram is depicted graphically below (click to enlarge).
Officials at the FDA are not in the business of saving lives, however. If a bad drug gets through their screens and kills, they lose their jobs. If a good drug never gets through, no one is ever penalized, as the consequences are not graphic. Below, we depict the FDA's scheme due to improper incentives (click to enlarge):
As we can see, because the FDA is risk-averse because of its suboptimal incentive scheme, it ends up, at the margin, killing many more individuals through its denial of live-saving drugs than it saves because of the marginal life saved by limiting a dangerous drug.

Individuals often state that among the first things the government should be doing after protection from coercion internationally through the military and internally through the justice system is setting up systems like the FDA.  What is not noted is that the FDA, because of poor incentives, kills many more individuals by withholding drugs than the private market would.  

A private system would be optimally incentivized because of the long-term, monopolistically competitive nature of its brand.  For those that think this wouldn't be a viable private enterprise, consider the 14 Californian kosher-certification services, or dozens of national certification services.  These companies have been successfully serving tiny portions of the United States population for decades.  Further, these companies have reason to avoid regulatory capture (unlike the FDA) because they are competing with other companies for consumer's trust (the FDA does not have competition).  

If anything, the FDA isn't among the first things government-loving individuals should push for--instead, an altruistic government-loving individual should abolish the FDA to save lives.  Any individual with a smidgeon of appreciation for the private market should be chomping at the bit to abolish the FDA and save lives, ease the pain of those denied efficient drugs, save the money of the poor who are denied price-reducing competition, and help improve the lives of individuals who might be benefitted by diet drugs endorsed by almost everyone but an intensely risk-averse FDA.  

Sunday, September 12, 2010

Trading Away the Stimulus

New York Times OpEd "Trading Away the Stimulus" (September 9th, 2010) presents a foolish analysis of trade, completely neglecting the notion of opportunity cost.
Also essential is a border tax to counter foreign export rebates. In countries with value-added taxes, those levies are returned to producers when they export their goods — which allows them to lower their products’ prices in our market. In response, we can ensure fair competition in our home market by applying a tax equal to the rebate upon a product’s entry to the American market.

COnsumers in the US are made unambiguously worse off by a tax on foreign imports. We show this in a graph depicting the US market for some good both before and after a border tax meant to counter a Chinese export subsidy. An analysis of the market in the US requires that we consider the total supply of goods, both Chinese and U.S.-made. Then, the total supply in the US market is found by adding US supply and Chinese supply. It may be that, due to a Chinese government subsidy of s per unit, Chinese suppliers are able to produce every unit more cheaply than US suppliers. This means that even with the same technology, their supply curve could lie below that of US producers. We depict the equilibrium in such a market below (click here to enlarge).


If the US counteracts the Chinese subsidy of s dollars with an import tax of t=s dollars, then the Chinese supply becomes identical to US supply, and we have a new equilibrium. We depict this market below (click here to enlarge).


Now consumer surplus (the green shaded area) is smaller than before, while US producer surplus (the red shaded area) is larger. Nonetheless, because the equilibrium price is higher in this regime, and quantity is lower, we as a country are worse off than we were without the tax. The gray shaded area shows the total loss to the US from a tax that would benefit a few marginal (high cost) producers. This again gives our rule of thumb for politics: whenever a group is pushing for more taxes or regulation, it is because they and government officials they fund are "putting one over" on consumers, taking their surplus and dividing it between them.

Friday, September 10, 2010

Seatbelts are the lifesavers in your car

New Orleans Times-Picayune editorial "Seatbelts are the lifesavers in your car" (September 9th, 2010) speaks positively of seat belts.  While they have undoubtedly saved lives, they have also undoubtedly cost them through the externalities their cost-shifting generates.
More Louisianians buckled up this year compared to last, according to the Louisiana Highway Safety Commission, but the New Orleans area actually saw a 1.1 percent decline in the percentage of people using seat belts.

Even with the statewide increase for drivers and front-seat passengers, which went from 74.5 percent to 75.9 percent, Louisiana still lags behind the nationwide usage rate of 83 percent.

That's discouraging, because buckling up is a simple and easy thing to do, and it's a proven life-saver.
The most interesting economic concept when it comes to seat belts and safety regulation is the "Peltzman Effect", as Sam Peltzman discusses in his 1975 Journal of Political Economy article "The Effects of Automobile Safety Regulation" (gated).  Below, we reproduce his diagram graphically (click to enlarge).  What the diagram indicates is that risky driving gives us something we enjoy--for example getting to our destination more rapidly.  Our first bit of risky driving is particularly beneficial--perhaps when we are in a hurry.  As we increase our risky driving, the marginal benefit decreases.  This is represented by the downward sloping red line. Under a regime with no seat belts, we end up at an equilibrium represented by point A on the risky driving schedule.  Under a regime with seat belts, we end up at an equilibrium represented by point B.  As driving becomes safer, we drive more riskily.
This, in turn may cause more pedestrian deaths, whose cost is presumably not fully borne by drivers.  Below, we graphically depict the relationship between risky driving and pedestrian deaths (click to enlarge).  We can see that pedestrian deaths rise as we go from point A and B.  (Point C will be discussed below).
As a thought exercise, famous among Austrian economists, is what would occur if instead of seatbelts or airbags, we installed a large spike in driving wheels, faced toward the driver a driving wheel looking similar to this:
In this case, we would have the following relationship between risky driving probability of death to driver (click to enlarge):

If this is the case, we end up at point C on the diagram above (again, click to enlarge).

This article serves to demonstrate a few concepts.  First, a common refrain on Corrections: when we reduce the cost of behavior that has benefits and costs, we increase the partaking of that behavior.  Second, when that behavior has externalities, as it does with driving, we may actually foist the cost of risky driving onto pedestrians rather than consumers.    

Tuesday, September 7, 2010

Who Should Provide Anesthesia Care?

New York Times article "Who Should Provide Anesthesia Care?" (September 6th, 2010) discusses the ability of a nurse to deliver anesthesia without supervision. It brings in the American Society of Anesthesiologists without properly discussing their stake in government regulation requiring anesthesiologists to supervise nurses.
The two studies — hotly disputed by the American Society of Anesthesiologists — essentially concluded that there is no significant difference in the quality of care when the anesthetic is delivered by a certified registered nurse anesthetist or by an anesthesiologist. The studies were paid for by the professional association for the nurses, a potential conflict of interest, but were conducted by researchers at respected organizations.
The Times notes the conflict of interest of nurses, but not of anesthesiologists.  As Corrections sees it, anesthesiologists have a readily identifiable conflict of interest, while it isn't immediately clear that nurses do, upon further inspection.

The American Society of Anesthesiologists has motivation to artificially constrict supply of anesthesiologists to raise their own wages.  It may do so by raising the quality of new anesthesiologists (more than patients would prefer), reducing the number of residents trained in anesthesiology, or encouraging a general suppression in the number of doctors through the American Medical Association. Their strategy is depicted graphically below (click to enlarge).  They price as monopolists, reducing quantity and increasing price.
One might say nurses have a similar motivation--if nurses can do more, demand for nurses rises, and nurses are paid more.  However, Corrections posits that unlike doctors, there is a vast reservoir of possible nurses; nurses are elastically supplied.  If their wage increased, new nurses would train and bring their wage back down.  Corrections depicts this possibility graphically below (click to enlarge).
Economic grounding gives Corrections reason to believe that while anesthesiologists have a conflict of interest influencing their argument, nurses do not.  This grounding offers a re-statement of a rule of thumb: when an organized group is pushing for governmental regulation, they're likely to be "pulling one over" on consumers.  

Some interesting economic side notes are that it would be possible for anesthesiologists wages to increase because of this (for the same reason that if a law that requiring them to build their own cars, or walk to work, was abolished, they'd have more free time to do the things they are paid a large amount for).  This counterintuitive result, that anesthesiologist wages could increase, while the wages of nurses would not is an interesting curiosity, but not likely given opposition by the American Society of Anesthesiologists.

Second, we note that either way, consumers should be better off (even were nurses and anesthesiologists were worse off).  The reason behind this is that they may prefer a different cost-quality combination for anesthesiology than they can get being constrained by government regulation--unconstrained maximization is always greater than or equal to constrained maximization.  

Saturday, September 4, 2010

After Bargains of Recession, Air Fares Soar

New York Times article "After Bargains of Recession, Air Fares Soar" (September 4th, 2010) ignores the global phenomenon in air fares to concentrate on the recent.
The increase in fares is the result of a remarkable discipline shown by the airlines, which have generally not added more flights this year even as the economy has improved and demand has picked up. For the airlines, flying fewer and fuller planes has paid off.
Passengers are paying the price. For leisure travelers, domestic fares have increased by more than 20 percent in the second quarter compared with a year earlier, according to data compiled by the travel Web site Orbitz.
Steven Berry and Panle Jia examine the changes in air fare demand between 1999 and 2006, finding in their recent article "Tracing the Woes: An Empirical Analysis of the Airline Industry" in American Economic Journal: Microeconomics (ungated working paper) (gated published), that, quoting their abstract:
Compared with 1999, we find that, in 2006, air-travel demand was 8 percent more price sensitive, passengers displayed a stronger preference for nonstop flights, and changes in marginal cost significantly favored nonstop flights. Together with the expansion of low-cost carriers, they explain more than 80 percent of legacy carriers' variable profit reduction.
This analysis (identified with BLP assumptions) occurred on a span of time before the recession pushed down further prices. As its its wont as the flagship of the left, the New York Times then turns around as soon as prices rise after declining for a dozen years and uses weasel words to describe Airline executives: "Airline executives have since been preaching the need to reduce the number of seats they offer."

It rather seems a joke, considering airline companies costs have gone down, low-cost carriers have become more prevalent, tickets have become competitive due to the internet, nonstop tickets are more common. When efficiency rises, marginal costs go down, quantity rises, and profits fall, it's difficult for consumers not to be massively better off (consumers that aren't New York Times consumers should be neutral when it comes to competitive profits--the reason they're relevant here is because when efficiency rises, overall surplus increases--if profits haven't risen, we know consumers have received all of the increased surplus).

Below, Corrections graphs out a way to indicate three stylized facts from Berry and Jia: prices fall, elasticity of demand increases, supply increases, and quantity supplied increases (click to enlarge). This is not the only way to depict these facts, and these are not the only facts from the paper, but they are suggestive enough that a first pass analysis seems to completely identify the direction of consumer surplus (coloring from blue to red, it unambiguously increases).

Friday, September 3, 2010

Enabling prostitution

Philadelphia Inquirer editorial "Enabling Prostitution" (09/03/2010) discusses prostitution in a misinformed manner. It further does not appropriately analyze counterfactual scenarios.
Some misguided observers of this debate actually believe there's nothing wrong with adults offering sex for money online. They ignore the fact that prostitution often involves other dangerous crimes, including robbery and assault. And sometimes these ads facilitate the illegal sex trafficking of women or girls who are being held against their will.
It is the case that forced prostitution is present in the United States. However, it is by no means clear that either a significant portion of prostitution is forced, nor that the level of forced prostitution would decrease when the difficulty of prostitution increases.

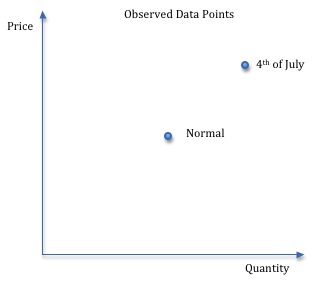
On the first point, we can take a recent empirical study on prostitution that requests no citation (citation will be given when the paper is published). What it indicates, however, is that there is a 63% increase in the number of tricks done on the 4th of July weekend. Forty-three percent of that apparently comes from full-time prostitutes. The other 20% comes from 4th-of-July-only prostitutes, part-time prostitutes that only come in because of the $11 average price increase. To Corrections, this sort of short-term supply elasticity, a vast reservoir that enters the market for one weekend only indicates voluntary prostitution.

If we assume that the 4th of July comes solely from a demand shock, that the fundamentals of supply remain the same, and approximating with linearity then we can identify the supply change (this is the source of the supply increase identification).

Below, we depict the pure data:

Here, we take the same data and add supply and demand lines, based on the idea that the 4th of July represents a demand shock:


On the second point, if we think that forced prostitutes are an inferior input into the production of prostitution, then enabling prostitution, causing an increase in the quantity supplied, will reduce their use in prostitution. The same concept might be applied to manual labor in manufacturing computers. It is likely that an increase from one computer demanded a year to several thousand would cause manual labor to all but disappear. So too with forced prostitution--cheapening the cost of supplying prostitution is likely to compete forced prostitution out of business.

Wednesday, September 1, 2010

N.Y. to Try Again to Tax Indian's Cigarette Sales

New York Times article "N.Y. to Try Again to Tax Indians' Cigarette Sales (August 31st, 2010) fails to note why a government tax program is ill-concieved.  New York is currently considering attempting to tax the cigarette sales of Indian reservations.  In an attempt not to tax reservation consumption of cigarettes, it will give vendors a lump-sum tax break.  This is the reverse of efficient taxation.
The state’s plan does make exceptions for cigarettes sold to tribal members, estimating, based on the population of an Indian reservation, what portion of the sales are made to them. Taxes are charged on the remaining packs, on the assumption that they are bought by customers who are not Indians.
In fact, this does not make reservations for tribal members.  Vendor prices should be the same for all cigarettes, sold to Indians on reservation or not.  The reason is that it appears stamps must be on all cigarette packs--there is no "dual supply" problem.  In this case, vendors will raise the price of all cigarettes by whatever the tax is (recognizing competition and constant returns to scale production) and simply take the tax cut as pure producer surplus.  The supply-and-demand equilibrium before and after is depicted below (click to enlarge).  The upper blue-to-red supply line depicts the taxed supply.  The red line depicts supply without tax.  As we can see, because of the law of one price, producers have in effect been given a lump sum transfer, which will not be reflected in their prices.

The structure of taxation will make this effectively a tax on on-reservation Indian consumption of cigarettes.

Saturday, August 28, 2010

The Mackerel Wars: Europe's Fish Tiff With Iceland

Time Magazine article "The Mackerel Wars: Europe's Fish Tiff With Iceland" (Friday, August 27th, 2010) discusses optimal common-pool resource exploitation but speaks of "sustainable" fishing as though a balanced stock required a single and unchanging level of fishing.
The Marine Stewardship Council, which issues fishery certification programs, said that if the fishing continued at this rate, mackerel would start to fall below sustainable levels by 2012.

Let's imagine governments, along with the alphabet soup of NGOs the Time article mentioned (SFM, WWF, MSC, FIFVO, CFP, and PEG), are capable of optimally exploiting a common-pool resource. We can further imagine there are two possible stochastic states of the world: high price for mackerel and low price for mackerel. Additionally, there is a stock of fish that can be consumed, and after consumption, the remaining stock multiplies.

In this case, we might have a dynamic programming problem summarized by a value function with fish stock S, consumption C, price-state $$\theta$$, and price $$P(C,\theta)$$ and growth rate r:

With the law of motion for fish stock:

In this case, with appropriate parameters and functional forms, solving the value function above we may have a consumption pattern that has a non-singlet ergodic set for fish stock that is above zero. That is, in "low" price moments, we "under-fish." In "high" price moments, we "over-fish." Below, we graph out next period's stock against this period's stock under the high price and low price states (click to enlarge).

As one can see, the ergodic set stretches from where the 45 degree line (stock today is the same as stock tomorrow) intersects with a low shock (a stock cannot possibly go below this point, even with an infinite series of low shocks), to where the 45 degree line intersects with a high shock (a stock cannot possibly go above this point, even with an infinite series of high shocks).

The important stylized fact to understand from this is that it's possible not to have a "steady state" of fish but instead have an ergodic set of possible levels of fish, a similar notion that optimally exploits the resource, dipping into it in "bad" times and saving in "good."

Saturday, August 21, 2010

U.S. Farmers Wary of Gaining From Russia's Woes

New York Times article "U.S. Farmers Wary of Gaining From Russia's Woes" (August 19th, 2010) offers a series of quotes from U.S. farmers that simply do not make sense when taken at face value. Specifically, wheat prices have gone up because Russia, a large producer of wheat, appears to have banned exports in the coming year. The New York Times quotes confused farmers that appear to suggest that they don't want to plant wheat, due to uncertainty about Russia's next moves:

Mr. Schroder said he feared that wheat prices were being driven by speculators, as was the case a few years ago, just before the recession, when the price soared and then crashed.

“What is this wheat market? I don’t have a clue, and I’m a professional wheat farmer,” he said. “There’s a complete lack of transparency.”

The problem the Times is pointing out is that farmers only know the current price, while their planting decisions should be based on prices in the future. They are subject to a large variability of even autoregressive prices. Corrections depicts such a movement graphically below, along with 95% error bands (click to enlarge).

A naive Times writer might instinctually think this represented a market failure. This is incorrect. Indeed, commodities futures markets, perennially despised by market-opposing individuals, are the market solution. However, the good news for farmers is that they do not have to bear any of the turbulence or non-transparency in the market at all. All they have to do to look at futures prices to plan their planting patterns. Why might this be?

Historical knowledge that appears to have been lost, even by some ideologically-motivated economists, is the very reason commodities markets, and commodities futures markets, were created. The Chicago Board of Trade (CBOT), to Correction's knowledge the oldest still-operating futures market, was created in 1848 to help farmers cope with fluctuating wheat prices.

The problem was as follows: farmers are often poor and unwilling to bear the risk of producing wheat and holding it until it is to be sold at some unknown price. What the Chicago Board of Trade did, and still does, is homogenize a good--in this case, sort wheat into bundles of the same quality, and allow a futures contract between speculators/investors, who are willing to bear the risk farmers don't want, and farmers, who are able to lock in the current price for their wheat. In this manner, all a farmer has to do is sell a futures contract in order to take all market-based uncertainty out of his decision to plant wheat--in selling the contract, he has, in effect, paid someone to bear the his risk. This allows him to plant the most valuable crop, even if its future prices are highly variable.

Therefore, farmers now only need to look at current futures prices--they should not care about the current price or what they think might happen to the price, only what the current futures price is. If we examine CBOT's wheat futures prices for July 2011, we see that the current futures price of corn is elevated (click to enlarge).

Farmers can lock in this price now. No risk necessary. It is important to note that a very large proportion of farmers do this every year, creating the massive derivative markets we have today. The only "risk" that a farmer would take is that he might miss out on higher prices now. Indeed, this is precisely the example the Times gives:

Another brake on any irrational exuberance over wheat will be farmers’ own suspicions, despite the incentives of higher prices.

Some think they are being played, and that the big run-up is partly, or largely, just market manipulation — like the increase in 2007 and 2008 that drove wheat prices more than twice as high as they are now before a gut-wrenching crash during the global recession.

'I hate to sound negative, but I’ve been burned so many dang times on wheat that I think I’m done,' said Olea McCall, who farms about 4,000 acres near the Kansas border, mostly in corn, wheat and sorghum. Mr. McCall said his attitude was not helped by missing out on the new rise in prices.

'I sold at 4, and three weeks later went to 6,' he said, referring to the price in dollars per bushel.

The Times continues:
“It took 20 years to sort the market out after [the similar 1972-73 Soviet Union crop failure],” Mr. Stulp said of the 1972-73 price bubble.

As much as the Times might write about "irrational" "bubbles" harming farmers, it supports the ridiculousness of the concept with its own quotes. Farmers need not fear any bubbles--they need only to lock in their high prices with futures contract and allow speculators to bear any "bubble" that might be present.

Thursday, July 29, 2010

In American politics, stupidity is the name of the game

Washington Post editorial "In American politics, stupidity is the name of the game" (July 29th, 2010) offers shrill ignorance when making a backhanded comment concerning economics.

That could never happen here because the fairy tale of supply-side economics insists that taxes are always too high, especially on the rich.


The author was referring to various tax solutions to the deficit, though the topic is not what concerns Corrections here. What we wish to deal with is the snide sciolism that E.J. Dionne Jr. displays in his dismissal of "supply-side" economics. Corrections offers just such a "fairy-tale" story here, reiterating Harald Uhlig's recent American Economic Review article "Some Fiscal Calculus" (May 2010) (Corrections previously spoke about a working paper version here).

In his concise paper, Uhlig undertakes to understand the "multipliers" of tax cuts and government spending. He does so in a typical, non-Keynesian model, though his result is stronger in a Keynsian model. We replicate his figures using his code. In our case, the most important portion of his paper is displaying the benefits of a tax cut and government spending (both are advocated as stimulus measures, the former Mr. Dionne is criticizing).

The first figure we display, Figure 2 in Uhlig's paper, is of the multipliers calculated for either government spending and a tax cut (click to enlarge). As we see, initially government spending has a high multiplier, while a tax cut has a low. However, because the spending must be paid for with higher taxes in the future, government spending's multiplier drops over time. Tax cuts, because they encourage growth and reduce distortionary taxes, have a positive multiplier.


Figure 4 of Uhlig's paper offers the dynamics of debt and the tax rate's increase for a government spending stimulus, displaying the reason why stimulus is worse in the long run (increased taxes) (click to enlarge).


Figure 5 displays the dynamics of government spending and output in the very long run, indicating the massive long-run tradeoff to output for a short-run boost to today (click to enlarge).


Uhlig concludes with the finding that with government spending stimulus, $3.40 of output is lost eventually when we discount it back to the present day, while cutting taxes generates $1.70 in extra output, discounted back to today.

The Washington Post, as is its wont, is in need of a permanent Correction to its deep-seated love of taxation.

Saturday, July 17, 2010

Larry Hagman of 'Dallas' fame becomes the new face of SolarWorld

The Oregonian article "Larry Hagman of 'Dallas' fame becomes the new face of SolarWorld" (July 13th, 2010) makes no effort to correct an utterly ludicrous statement by a solar energy spokesman:
"When affordable oil gives out, we're in real trouble -- I mean the collapse of civilization, within 15 to 20 years."
If oil companies thought that the price of oil would skyrocket in the next couple of decades, then they would hold on to this storable asset and sell only when the price skyrocketed, causing supply to decrease and current price to rise. This continues until oil companies are indifferent to selling now or later. What does this imply about an oil "shortage" in the coming years? It implies that quantity will fall predictably, based on the shape of the demand curve.  As price rises, quantity demanded falls.  When it becomes optimal, we will substitute into new energy sources.

In the figures below, the red dotted lines represent a theoretical "renewable energy only" world, while the solid red line represents the observed portion of renewable energy use in a world when both renewable energy and nonrenewable energy is available. The solid blue line represents observed nonrenewable energy prices and use in a world in which both renewable and nonrenewable energy are available, while the dotted line represents price and use in a theoretical "nonrenewable energy only" world (click here to enlarge).

We see that the price of energy should go up, in our simple model, at the interest rate, while we use oil. Consumers will buy renewables when they become cheaper than energy (the red-line price in the top figure).  Energy use falls gradually to a stable level (click here to enlarge).


In this model, there are no sudden shocks to oil consumption and no unexpected price increases. Rather, oil prices increase predictably, and the amount of energy we consume falls gradually and predictably. To predict the "collapse of civilization" in an article about new technologies is completely misguided.

Wednesday, July 14, 2010

LeBron James: True to his generation

LA Times OpEd "LeBron James: True to his generation" (July 13th, 2010) suggests that young workers are more mobile than older workers. Apparently, this all has to do with generational-characteristics, not economics.
If younger workers have displayed anything as employees, it's that they prize mobility more than they do fidelity to their employers.

"Stability and company loyalty are high values for . . . those whose worldviews were shaped by experiencing the Great Depression in their formative years," Chip Espinoza, Mick Ukleja and Craig Rusch write in their new book, "Managing the Millennials." "But the work world has changed."
At all ages, workers seek to find a job at which they can earn the highest wage, and employers seek the best workers. Since it is not possible to know one's productivity perfectly before actually working at a particular job, workers will not necessarily find their best job immediately, and will continue to look for jobs until they find the one that they believe suits them best. Hopefully, by the time they are 50 all workers will have found their best job.

In addition, unlike their older counterparts, young workers sometimes are building their human capital while working. For example, they may be enrolled in a part time business school. When they are done, the will be able to find a better job. This move has nothing to do with "disloyalty," since firms rarely have higher-level positions ready and waiting for such workers.

The notion that young workers should stay put is completely out of equilibrium, and would likely only occur when productivity differences and wage differences between jobs were trivially small. In the current job market, this is not the case.

Saturday, July 10, 2010

Farm Work should be an honored, palatable job for Americans

Los Angeles Times article "Farm Work should be an honored, palatable job for Americans" (July 10th, 2010) bemoans the decline in wages for farm workers but completely ignores the economics behind these fluctuations.

By 1981, the contract provided about double minimum wage, at which point we were probably the best-compensated grape pickers in the world. We had paid holidays, and for high-seniority workers, two weeks' paid vacation; disability and unemployment insurance; family medical insurance (with 60 hours of work or more in a month); even a modest pension plan. The Coachella Valley had a UFW medical clinic for the workers and their families, and a legal aid center to help with taxes, Social Security and other issues.
The legacy of David Freedman Co. under the UFW contract is one all Americans can be proud of. It is proof that American agriculture does not have to be based on the labor of an underclass denied the rights and benefits of other workers.
Sadly, only one UFW contract remains in the Coachella Valley, and wages and benefits are not as generous as they were 25 years ago.

In fact, wages in these competitive markets are not set by the sentiments of Americans, but rather by market forces. For example, if demand for produce increased, then firms would want to increase their production. However, most farmers were likely constrained in their ability to purchase more capital (farm equipment) and so were only able to increase their demand for farm labor. This caused an increase in farm worker wages.

Again, the reason that wages increased by as much as they did may simply have been that in the short run, capital is inelastic. In the long run, it is perfectly elastic. Thus, the long-run rise in wages would be heavily mediated by substitution into high capital-share production.